


LookerのCustom Visualizationを試す
投稿者:中根
Looker Advent Calendar 2019 – Qiitaの16日目の記事です。
今回はLookerのCustom Visualizationについて紹介したいと思います。
Custom Visualizationとは
Lookerには標準で色々なVisualizationが用意されていますがユーザにて作成できるのがCustom Visualizationです。
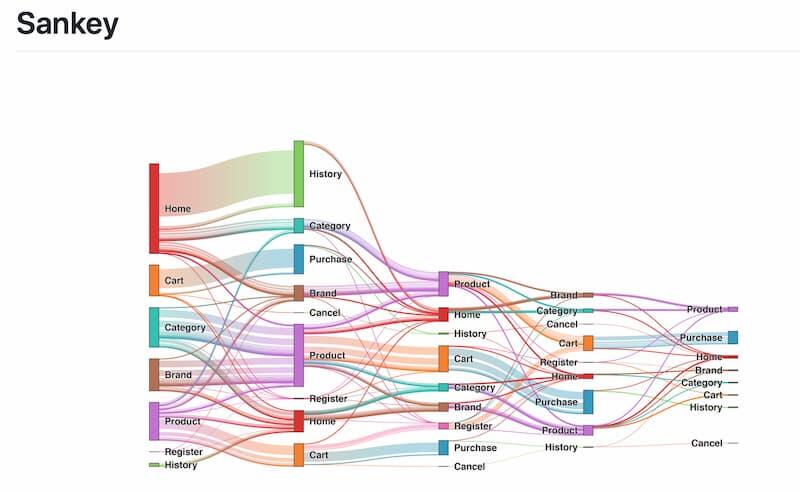
アドベントカレンダー6日目のymtoさんの記事にもあったサンキーダイアグラムLookerでサンキーダイアグラムの可視化手順をまとめてみた – Qiitaや、
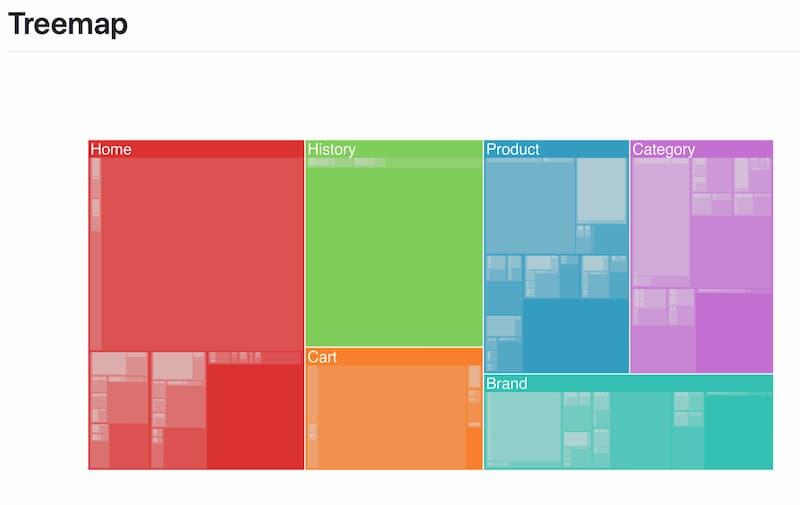
ツリーマップなどがGitHub – looker/custom_visualizations_v2に用意されています。
もちろんここまで複雑なものではなく、すこしだけカスタマイズしたい時、エンベデッド作成するほどではないんだけど、という時にも重宝します。
Custom Visualizationの有効化
有効にするにはAdmin権限が必要となります。
Admin Settings – Visualizationsに手順はありますが大きく以下の3ステップで表示が可能となります。
- Admin-General-LabsからSandboxed Custom Visualizationsを有効にする。
- Admin-Platform-VisualizationのAdd Visualizationをクリック
- MainにJavaScriptのパスを指定。
作ってみよう
Custom Visualization自体はJavaScriptで作成します。またReactにも対応しています。
Githubにスタートガイドがあるのでこちらを参考にしてみると良いでしょう。
今回はスタートガイドのHello Worldを元にwojtekmaj/react-calendarを使用してLookerにカレンダーを表示してみます。
基本的にはHello Worldを元にReact-calendarのサンプルを組み込んでいきます。
import React from 'react'
import ReactDOM from 'react-dom';
import Calendar from 'react-calendar';

class LookerCalendar extends React.Component {
    constructor(props) {
        super(props);
        this.state = {
            activeStartDate: props.activeStartDate,
            events: props.events,
            font_size: props.font_size
        };
        this.getTileClass = this.getTileClass.bind(this);
        this.getTileContent = this.getTileContent.bind(this);
    }

    // Formatter
    getFormatDate(date) {
        return `${date.getFullYear()}-${('0' + (date.getMonth() + 1)).slice(-2)}-${('0' + date.getDate()).slice(-2)}`;
    }

    // Holiday and Weekend
    getTileClass({ date, view }) {
        // Only Month view
        if (view !== 'month') {
            return '';
        }
        const day = this.getFormatDate(date);
        if (this.state.events[day] && this.state.events[day].holiday === 'Yes') {
            return 'holiday'
        } else if (this.state.events[day] && this.state.events[day].weekday === 0) {
            return 'sunday'
        } else if (this.state.events[day] && this.state.events[day].weekday === 6) {
            return 'saturday'
        } else {
            return ''
        }
    }

    // Event
    getTileContent({ date, view }) {
        // Only Month view
        if (view !== 'month') {
            return null;
        }
        const day = this.getFormatDate(date);
        // If there is content, display
        return (
            <p style={{ fontSize: this.props.font_size }}>
                {(this.state.events[day] && this.state.events[day].text) ?
                    this.state.events[day].text : <br></br>
                }
            </p>
        );
    }

    render() {
        return (
            <div>
                <Calendar
                    tileClassName={this.getTileClass}
                    tileContent={this.getTileContent}
                    activeStartDate={this.props.activeStartDate}
                />
            </div>
        );
    }
}

looker.plugins.visualizations.add({
    // Id and Label are legacy properties that no longer have any function besides documenting
    // what the visualization used to have. The properties are now set via the manifest
    // form within the admin/visualizations page of Looker
    id: "calendar",
    label: "Calendar",
    options: {
        font_size: {
            type: "string",
            label: "Font Size",
            values: [
                { "Large": "large" },
                { "Small": "small" }
            ],
            display: "radio",
            default: "large"
        }
    },
    // Set up the initial state of the visualization
    create: function (element, config) {

        // Insert a <style> tag with some styles we'll use later.
        element.innerHTML = `
            <style>
                .react-calendar__month-view__weekdays__weekday abbr{text-decoration: none;}
                .holiday{ color: #ff0000;}
                .sunday{ color: #ff0000;}
                .saturday{ color: #0000FF;}
                }
            </style>
            `;

        // Create a container element to let us center the text.
        let container = element.appendChild(document.createElement("div"));
        container.className = "calendar";
        this._element = container.appendChild(document.createElement("div"));
    },
    // Render in response to the data or settings changing
    updateAsync: function (data, element, config, queryResponse, details, done) {

        // Clear any errors from previous updates
        this.clearErrors();

        // Throw some errors and exit if the shape of the data isn't what this chart needs
        if (queryResponse.fields.dimensions.length == 0) {
            this.addError({ title: "No Dimensions", message: "This chart requires dimensions." });
            return;
        }
        // Set the size
        let font_size = config.font_size || this.options.font_size.default;
        if (config.font_size == "small") {
            font_size = "12px";
        } else {
            font_size = "24px";

        }

        // Parse Event
        let events = {}
        let days = []
        for (var row of data) {
            let date_cell = row[queryResponse.fields.dimensions[0].name].value;
            let content_cell = row[queryResponse.fields.dimensions[1].name].value;
            let holiday_cell = row[queryResponse.fields.dimensions[2].name].value;
            // Parse Date object
            const date = new Date(date_cell);
            events[date_cell] = {
                text: content_cell,
                weekday: date.getDay(),
                holiday: holiday_cell
            };
            days.push(date);
        };
        const max_date = new Date(Math.max.apply(null, days));
        const start_date = new Date(max_date.setDate(max_date.getDate() - 30))

        // Finally update the state with our new data
        this.chart = ReactDOM.render(
            <LookerCalendar
                activeStartDate={start_date}
                events={events}
                font_size={font_size}
            />, this._element
        );

        // We are done rendering! Let Looker know.
        done();
    }
});
上記ソースをyarnでビルド、dist配下に出力されたファイルをアップロードしましょう。
アップロードしたファイルをパスをAdmin-Platform-Visualizationから登録しましよう。
うまく指定できていればVisualizationsの中に作成したラベルが表示されています。
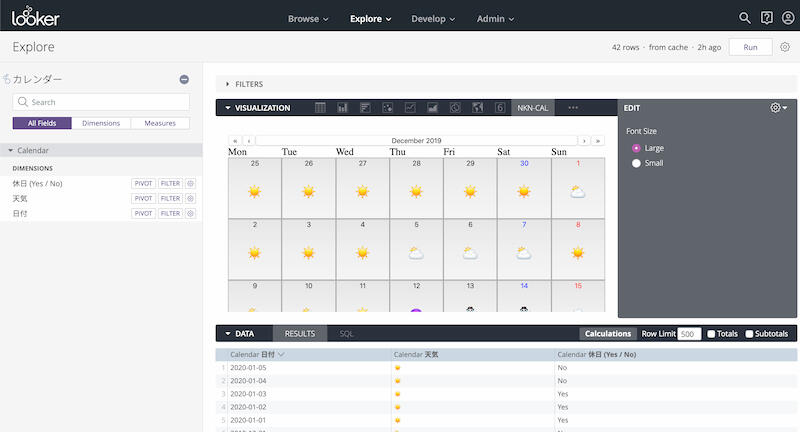
このCustom Visualizationに以下のようなクエリ結果を与えた時にカレンダーを表示します。
- 1列目: 日付
- 2列目: テキスト
- 3列目: 祝日フラグ(Boolean)
また、Custom Visualizationでもオプションが設定ができます。
今回は文字サイズをラジオボタンで選択できるようにしてみました。
*フォントの更新は再描画のタイミングですが。。。
今回の例ではテキストをアイコンで表示しています。
小売店の店員のようにダッシュボードをじっくり確認することが難しいユーザに対して売り上げの達成率をアイコンを使用して表示するといった使い方をすることで直感的に情報を把握できるようになるのではと思います。
ほかにも
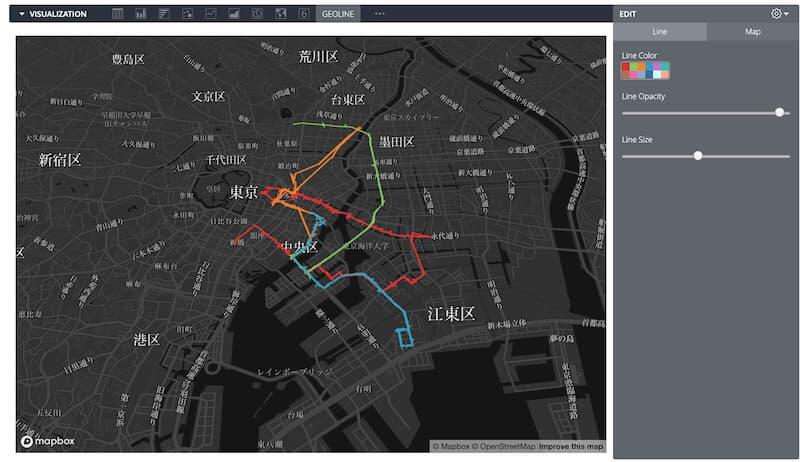
以下の画面は弊社が今年のNext Tokyoで作成したデモ用ダッシュボードの一部です。
車毎の走行情報を可視化しています。
標準の地図でも2地点間をつなげて表示ができますが、細かな移動経路の表示ができなかったのでBigQueryのGIS関数と組み合わせて移動経路の表示を可能としています。
まとめ
今回Custom Visualizationを利用してみましたがJavaScriptを使用できるので非常に強力です。
ただ、なんでもかんでもCustom Visualizationを利用するかどうかは気をつけなければいけない点が多いです。
まずはパフォーマンス。処理の方法によっては表示にかなり時間がかかることがあります。
次にサポート。Custom Visualizationはコミュニティサポートとなります。つまり、何か不具合が会った時はLookerのサポートへチャットすることはできません。
私個人としては上記のことからより複雑なVIsualizationが必要になった場合はAPIを用いたアプリを作成した方が良い場合が多いのかなという印象です。
ただ、先日発表のあったLoker7ではCustom Visualizationの強化や、マーケットプレイスといった発表があったのでこれから変わっていくと思います。
弊社では1月30日(木)に「Lookerで実現する次世代BI」と題しセミナーを行います。
BigQuery・Redshift・Treasure DataなどのCloud DBをご利用もしくは、
導入をご検討中の皆様のご参加を心よりお待ち申し上げております。
